M31 MOS radial XSherpa inspect comparison
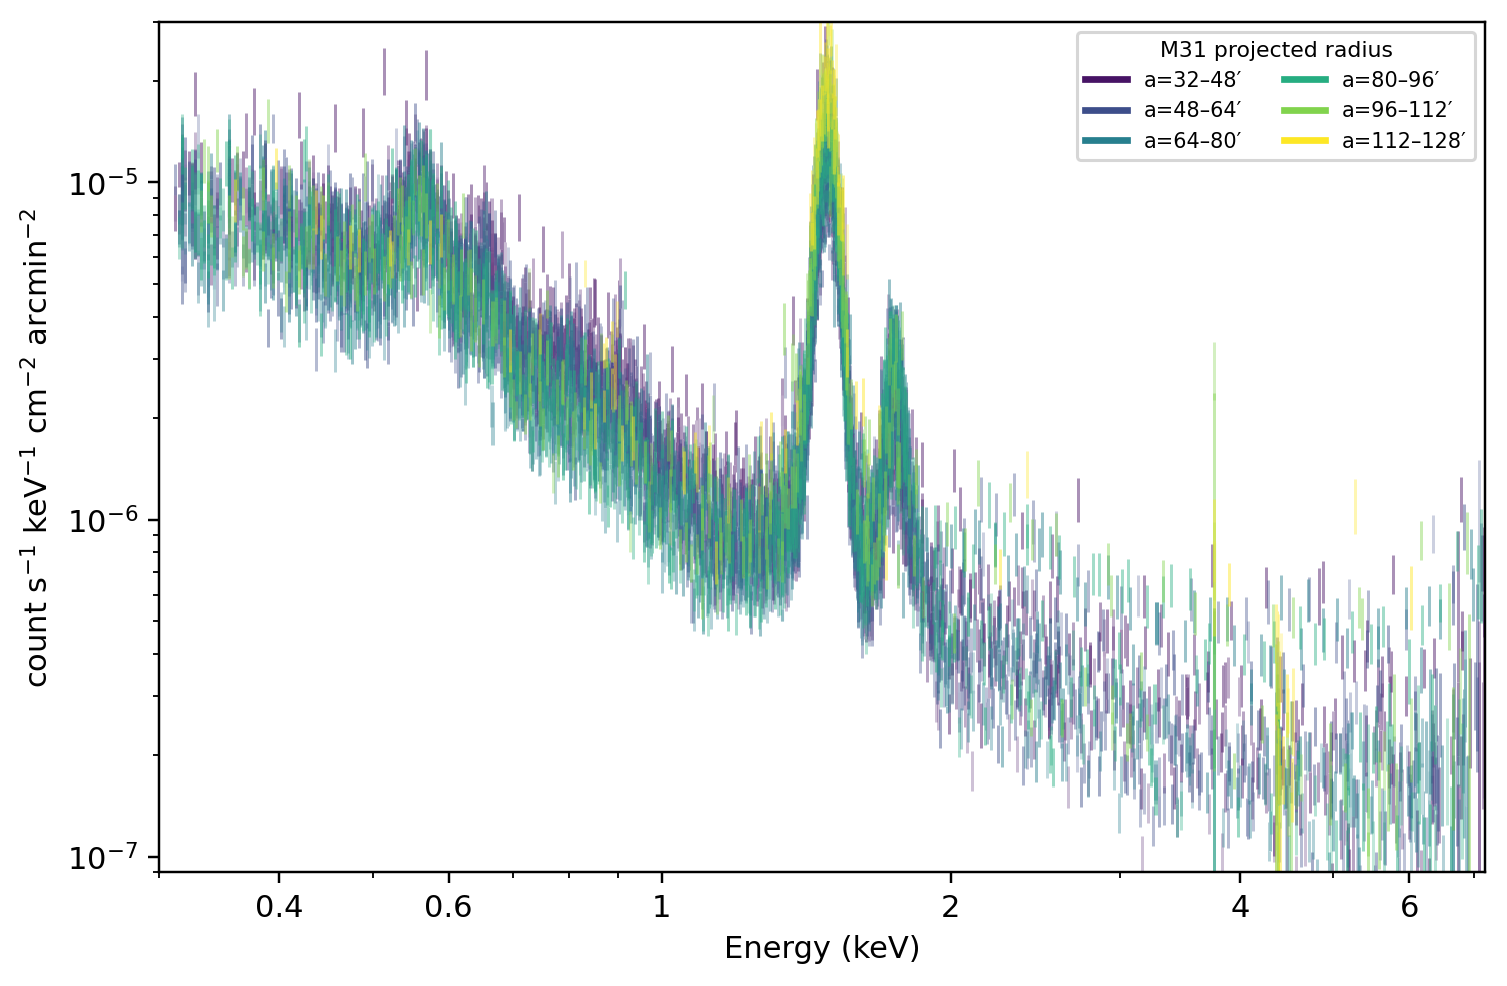
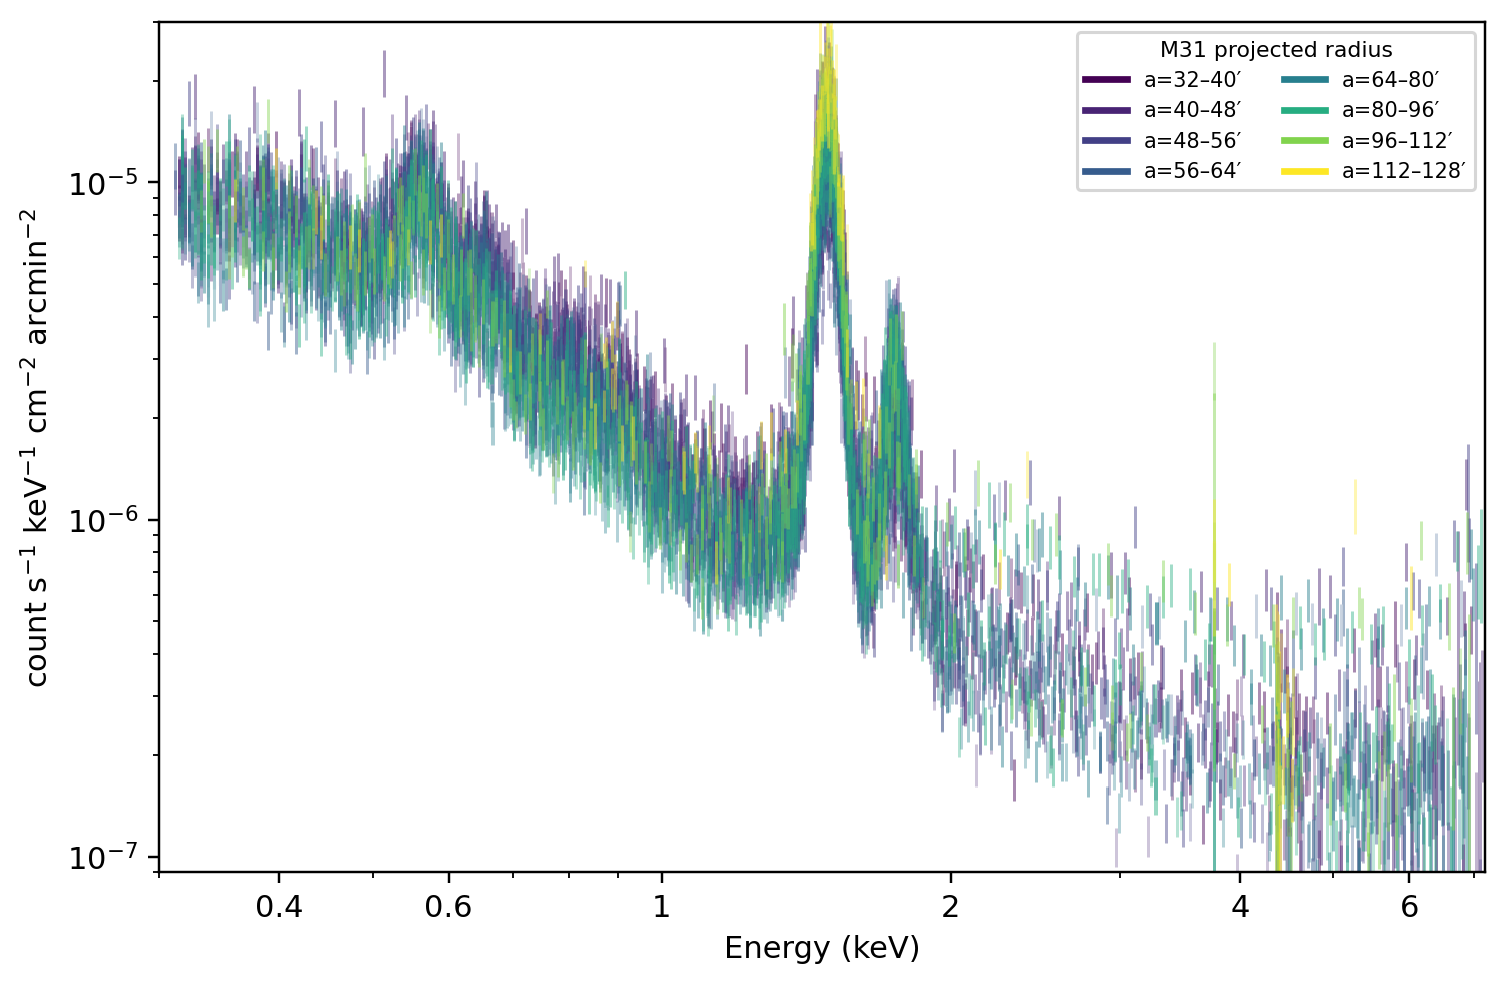
All available MOS1/MOS2, ObsID spectra are shown in the same panel with one color per annulus. Colors gradient continuously from inner to outer annulus center radius; color does not encode camera, ObsID, or model component.
xsherpa.inspect.SpectrumInspector region-overview traces re-colored on the same axis. Original inputs are PHA + QPB + ARF + RMF, QPB-subtracted first, then grouped with XSherpa standard net S/N ≥ 6 and RMF FWHM oversampling ≤ 6; y-axis is sb_flux, range 9e-8–3e-5. This page does not reopen spectrum files, and has no model, fit, coadd, stack, or Sherpa session save. 1.4–2.0 keV is only a visible inspection channel, not interpreted or fitted as instrumental lines.Radial comparison I: 16′ bins only
16′ bins: a=32–48′, 48–64′, 64–80′, 80–96′, 96–112′, 112–128′.
276 receipt-published MOS camera quartets; 276 positive QPB-subtracted grouped traces plotted. All MOS1/MOS2, ObsIDs for each region remain independent; no coadd or stack.
Radial comparison II: prefer 8′ inner bins
Prefer 8′ inner bins: a=32–40′, 40–48′, 48–56′, 56–64′; outer continues with a=64–80′, 80–96′, 96–112′, 112–128′. Therefore a=32–48′ and 48–64′, which overlap the first four 8′ bins, are not included simultaneously.
376 receipt-published MOS camera quartets; 376 positive QPB-subtracted grouped traces plotted. All MOS1/MOS2, ObsIDs for each region remain independent; no coadd or stack.
Color and region list
| Plot | region | Fixed color (inner → outer) |
|---|---|---|
| Radial comparison I: 16′ bins only | a032_048 | #471365 |
| Radial comparison I: 16′ bins only | a048_064 | #3d4e8a |
| Radial comparison I: 16′ bins only | a064_080 | #277f8e |
| Radial comparison I: 16′ bins only | a080_096 | #26ad81 |
| Radial comparison I: 16′ bins only | a096_112 | #81d34d |
| Radial comparison I: 16′ bins only | a112_128 | #fde725 |
| Radial comparison II: prefer 8′ inner bins | a032_040 | #440154 |
| Radial comparison II: prefer 8′ inner bins | a040_048 | #482374 |
| Radial comparison II: prefer 8′ inner bins | a048_056 | #424086 |
| Radial comparison II: prefer 8′ inner bins | a056_064 | #365c8d |
| Radial comparison II: prefer 8′ inner bins | a064_080 | #277f8e |
| Radial comparison II: prefer 8′ inner bins | a080_096 | #26ad81 |
| Radial comparison II: prefer 8′ inner bins | a096_112 | #81d34d |
| Radial comparison II: prefer 8′ inner bins | a112_128 | #fde725 |
Model-free direct data band flux and radial profile
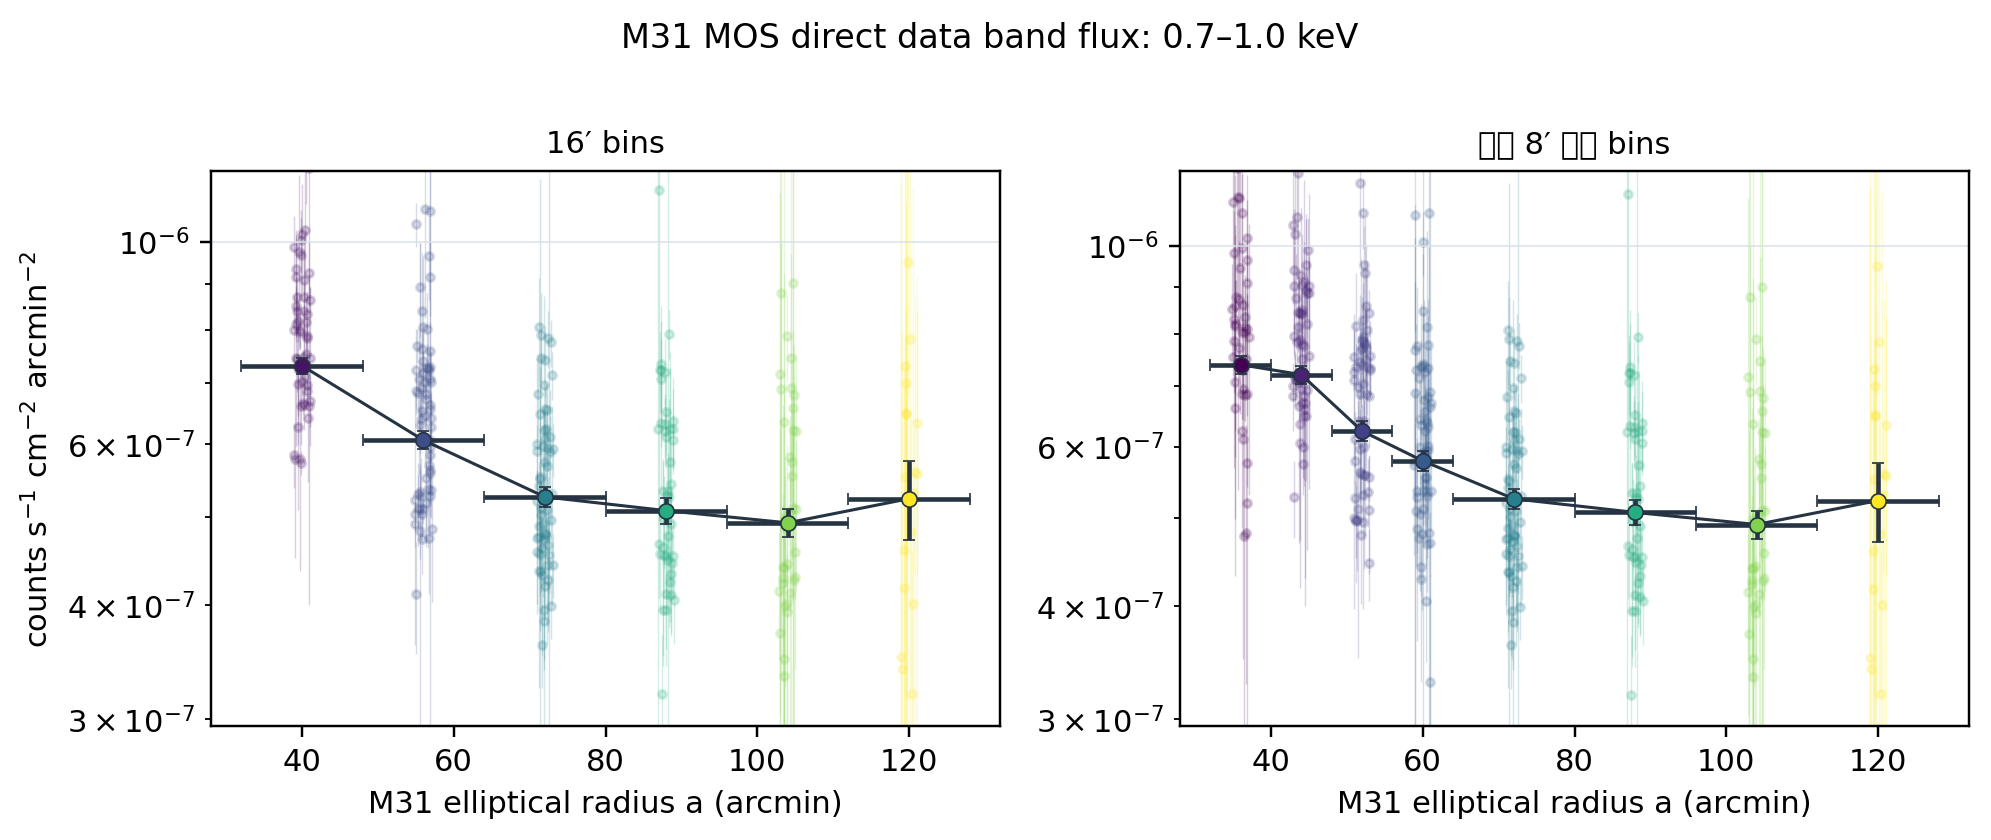
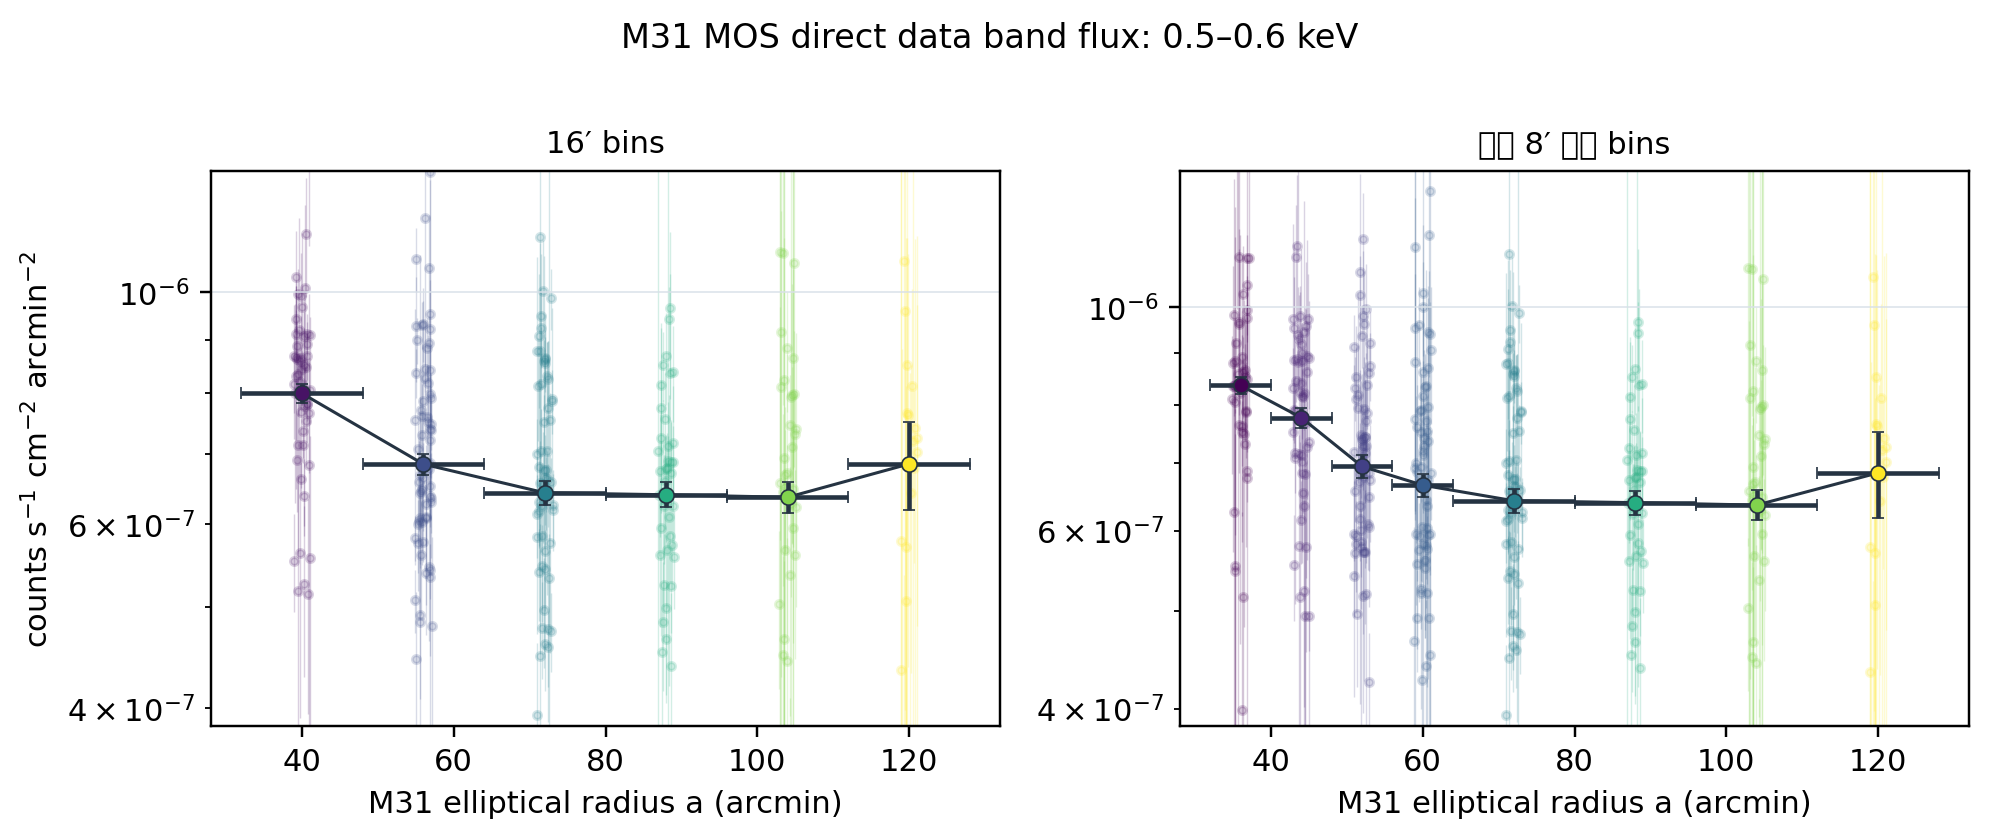
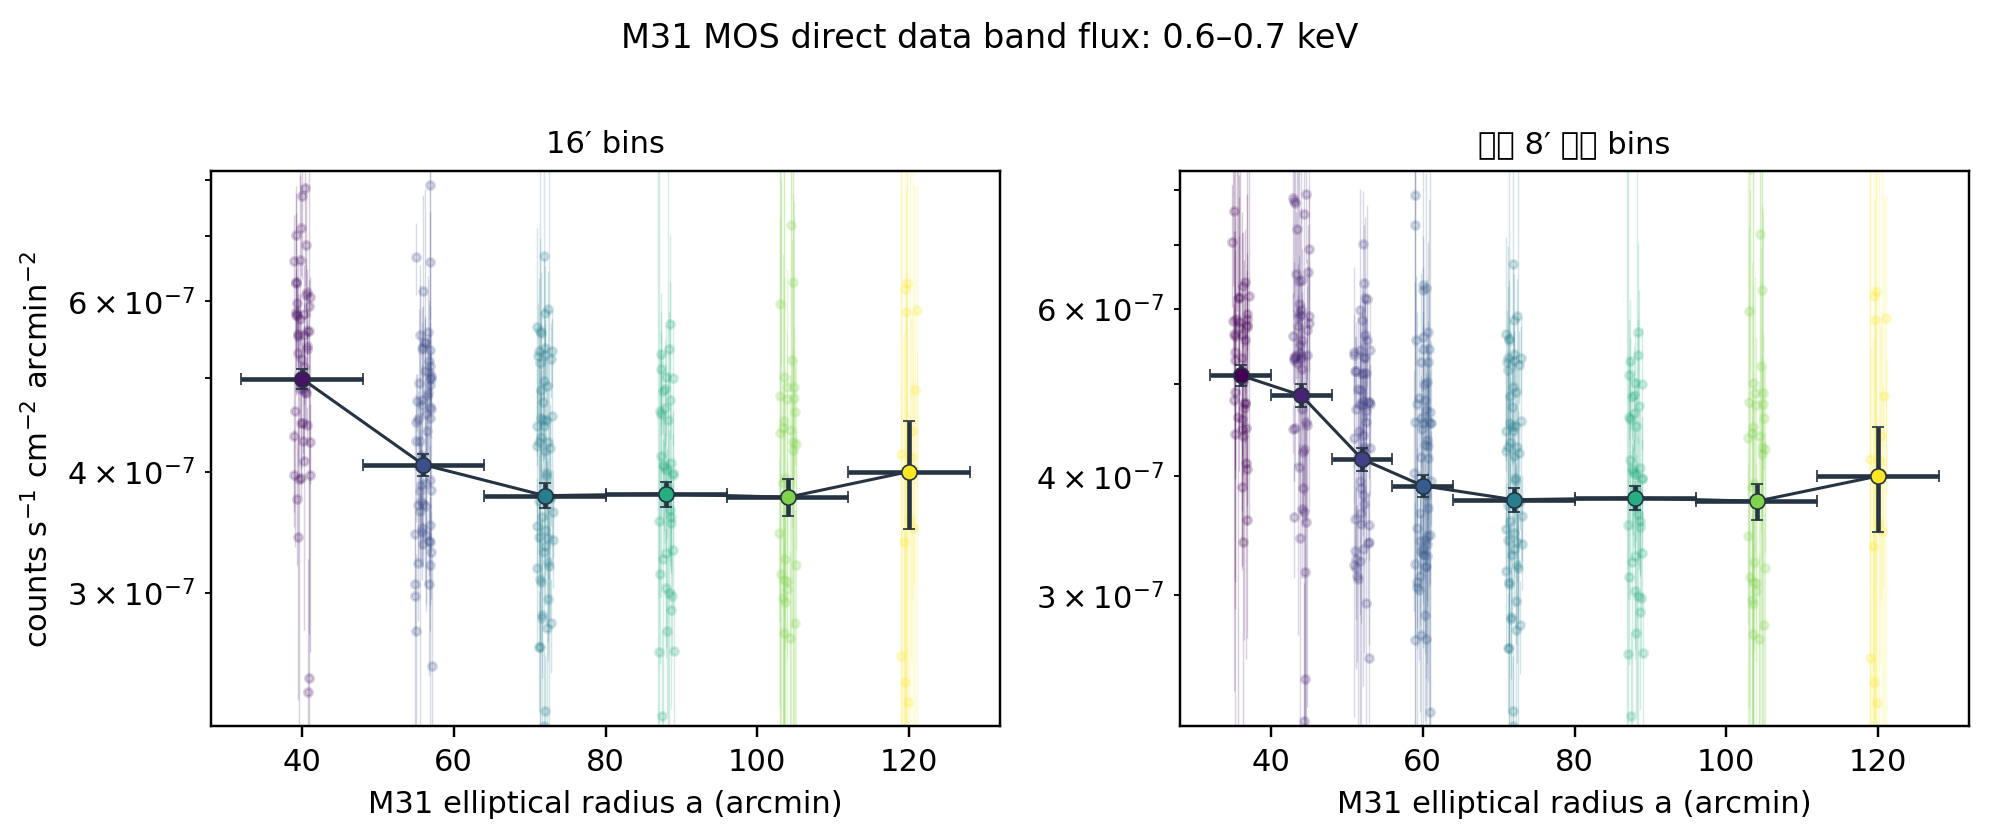
Each light-colored point is an independent ObsID×MOS1/MOS2 spectrum; solid lines and dark points are inverse-variance averages within the same region. Horizontal error bars are annulus half-widths; vertical errors include a Birge factor for extra scatter beyond pure statistical error.
sb_flux, then integrated by exact overlap width of channel and band. Thus output is counts s−1 cm−2 arcmin−2. Grouping in the figure exists only in the spectral shape inspection above and does not participate in values here.Left/right panels of each figure use mutually non-overlapping 16′ bins and "prefer 8′ inner bins" definitions respectively, avoiding double-counting a=32–48′, 48–64′ and their 8′ sub-bins in the same profile.
Direct data band flux: 0.5–0.6 keV
Direct data band flux: 0.6–0.7 keV
Direct data band flux: 0.7–1.0 keV